INDEX
Monitor Peers and Environments
Monitor your components through charts and graphs generated from real-time data. Performance metrics are provided for the CPU, network, memory, and disk of a component.
Use the filters on each tab to select the specific component that you want to view.
- Peer
On the Peer tab, select the host and period.
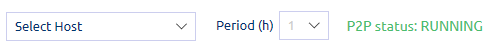
The current P2P status is also displayed beside the filters. - Environment
On the Environment tab, select the environment, container, and period.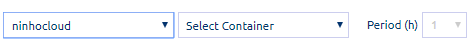
- Management
On the Management tab, select a period to view the performance of the Console.
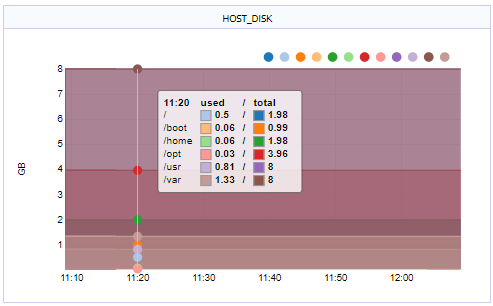
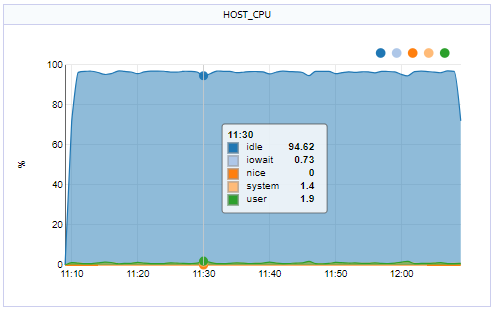
Hover over a graph or chart to view actual figures. The following images are from Peer metrics:
- CPU - percentage of usage for system and user
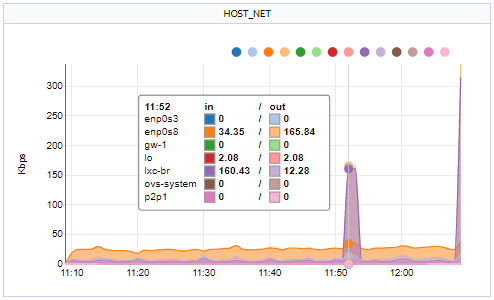
- Network - incoming (in) and outgoing (out) data transmission metrics
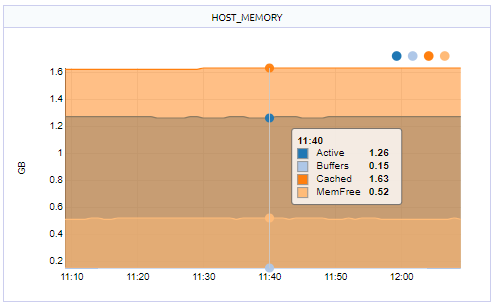
- Memory - cache and other RAM metrics
- Disk - used and total disk space (in GB), with breakdown of usage per directory